Analyzing QC Reports in Excel: A Comprehensive Guide for Medical Labs
Learn how to analyze comprehensive QC reports in medical labs with our detailed guide, covering data collection, analysis, and documentation.
Brannon Hogue
7/7/20243 min read


If you're anything like me, you understand the importance of quality control (QC) reports in identifying future trends and preventing issues in the lab. These reports are essential for maintaining regulatory compliance and supporting accreditation status. In this guide, we’ll walk you through the process of analyzing QC reports for your lab.
Comprehensive Guide to Analyzing QC Reports in Medical Labs in Excel
-Using LIMS or QC Software Leverage your Laboratory Information Management System (LIMS) or specialized QC software like LabQCPro to efficiently organize and store collected data.
-Data Management Start by gathering QC data relevant to your lab and workflow. If you lack a system for this, it's crucial to input and categorize data into an Excel sheet properly. This step ensures that data is readily available if you do not have a way to automatically export the data.
Analyzing QC Data
- Calculating Key Metrics: Use excel to calculate essential statistical metrics, such as mean, standard deviation, and coefficient of variation. Understanding these metrics helps in identifying trends and deviations. We have some examples below + a free template with all of the examples implemented.
Download our example excel sheet with premade formulas to help with your analysis.


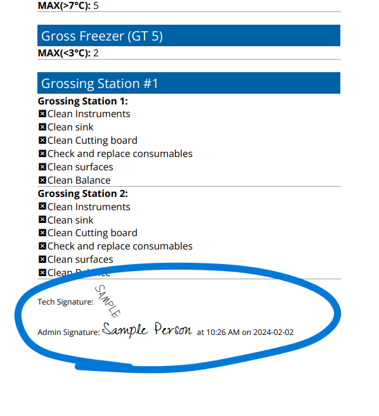
Digitize your labs daily and weekly equipment QC checklist
Build custom QC forms to match your lab’s unique workflow requirements
Record any data type on electronic tablet in place of paper forms
Entered data is compared to reference ranges in real-time.
Out-of-range QC data automatically triggers mandatory corrective action events
All forms require full completion and signature before submission
Supervisors can review and sign submitted forms from their desk or device


Mean (Average)
Description: The mean provides the central value of your data set.
Excel Formula: =AVERAGE(range)
Example: =AVERAGE(A2:A20)
Standard Deviation
Description: Standard deviation measures the amount of variation or dispersion in a data set.
Excel Formula: =STDEV.P(range) for population standard deviation or =STDEV.S(range) for sample standard deviation.
Example: =STDEV.P(A2:A20)
R-Value (Correlation Coefficient)
Description: The R-value indicates the strength and direction of a linear relationship between two variables.
Excel Formula: =CORREL(range1, range2)
Example: =CORREL(A2:A20, B2:B20)
Variance
Description: Variance measures the spread between numbers in a data set.
Excel Formula: =VAR.P(range) for population variance or =VAR.S(range) for sample variance.
Example: =VAR.S(A2:A20)
Confidence Interval
Description: A confidence interval gives an estimated range of values likely to include the population parameter.
Excel Formula: Use the CONFIDENCE.NORM or CONFIDENCE.T functions.
Example: =CONFIDENCE.NORM(0.05, STDEV.P(A2:A20), COUNT(A2:A20))
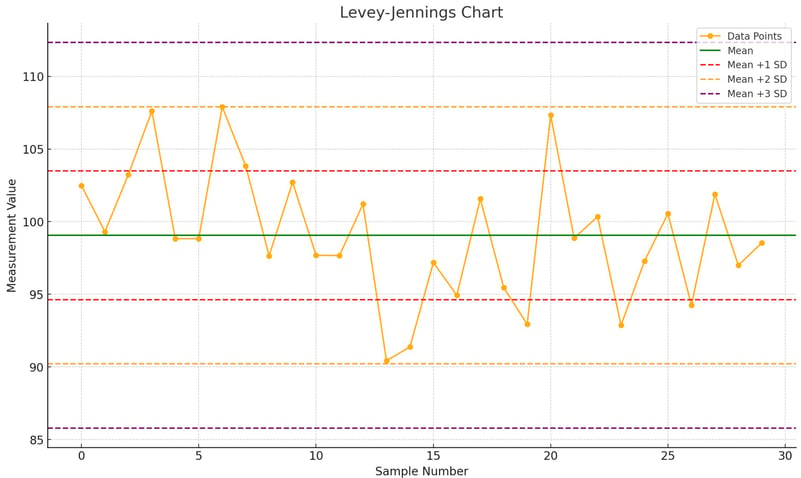
[ADVANCED] Levey-Jennings Chart
Description: A Levey-Jennings chart is used to visualize the performance of QC data over time.
Step-by-step:
Calculate Mean and Standard Deviation: Use =AVERAGE(range) and =STDEV.P(range).
Create Data Points: List your data points in a column.
Create Control Lines: Calculate the control lines (mean, mean ±1 SD, mean ±2 SD, mean ±3 SD).
Format Data: Insert control lines into columns of equal length to data you are plotting using: =$B$2 (example) and drag to data column length.
Insert Line Chart: Highlight all of the data, go to Insert > Line Chart, and plot your data points along with control lines.
Visual Tools
- Levey-Jennings Chart: Create Levey-Jennings charts to visualize control data over time. These charts help in detecting trends and shifts in the data. You can do this in excel or use excel plugins.
Results Summary
- Presenting Results: Summarize QC results using tables and graphs for clarity. Highlight any deviations or significant findings to ensure they are easily understood.
- Corrective Measures: Detail the steps taken to address identified issues, including re-calibration of equipment, process adjustments, and staff retraining. Proper documentation of these actions ensures accountability and facilitates future reference.
- Comprehensive Documentation: Ensure that all corrective actions are thoroughly documented. This documentation should include the identified issue, the steps taken to resolve it, and any follow-up actions.
Contact Us
915 Deedra Avenue Pensacola, FL 32502 United States
(850) 696-7438
info@labqcpro.com
